Your Dashboard Is Lying to You: Separating Operational Signal from Boardroom Noise
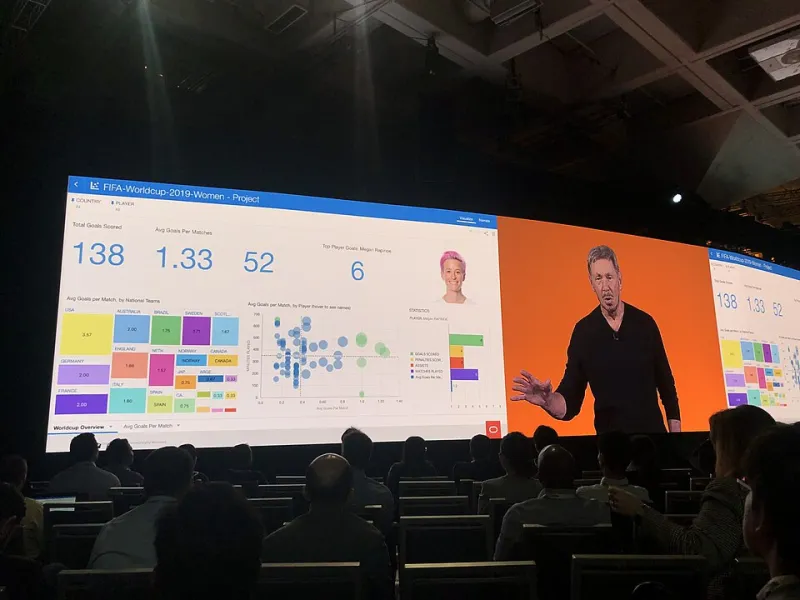
Photo: GeneralAB13, CC BY-SA 4.0, via Wikimedia Commons
Walk into any operations review at a mid-sized or large American company and you will see it: a wall of dashboards, color-coded and dense, tracking everything from logins to training hours completed. The implicit promise is that more measurement means more control. In practice, most of these metrics measure activity—and activity is a poor proxy for health.
The distinction matters because metrics are not passive. What a leadership team inspects, the organization optimizes. Fill your reviews with the wrong numbers and you will get weeks of effort spent improving numbers that tell you nothing about whether the business is actually getting better.
Five Indicators Worth Your Attention
1. Cycle-time variance, not cycle-time average. Averages hide the story. Two fulfillment operations can both average twelve days, but one runs a tight nine-to-fifteen while the other swings from four to thirty. Variance is where customer frustration, expediting costs, and working capital live. Shrinking variance is often the fastest route to both margin and satisfaction improvements.
2. Margin velocity. Margin percentage is a snapshot; margin velocity is the rate at which it is improving or eroding. Tracking the derivative—basis points per quarter, by product line—surfaces deterioration months before it shows up in annual results, when there is still time to act.
3. First-pass yield. The percentage of work completed correctly the first time, without rework, escalation, or exception handling. It applies equally to a manufacturing line in Michigan and a claims-processing team in Dallas. Low first-pass yield is the single most reliable early warning of process debt.
4. Time-to-decision. How long does it take, from request to resolution, for the decisions that govern your operation—credit approvals, pricing exceptions, change orders? Slow decision latency taxes everything downstream and is one of the few metrics that reliably distinguishes high-performing organizations from average ones.
5. Capacity utilization of critical resources. Not overall headcount efficiency, but the utilization of the specific people, machines, or systems that constrain throughput. When your constraint is at ninety-eight percent, everything upstream becomes queue. Managing to the constraint, as any reader of Goldratt knows, beats managing to the average every time.
Three Metrics to Retire
Login and adoption counts. 'Number of users on the new platform' tells you someone opened the tool, not that they got value from it. It is the corporate equivalent of counting gym memberships.
Training hours completed. Hours invested is an input. If a leadership program does not move a behavioral or performance metric within two quarters, the hours were a cost, not an investment.
Volume of strategic initiatives launched. This one is seductive because it photographs well in the annual report. But initiative count rewards proliferation, and proliferation is precisely what fragments focus. A leadership team that launches five programs and finishes two is underperforming one that launches two and finishes two.
Rebuilding the Review
The practical move is not to add metrics but to subtract. Pick one leading indicator per value stream—one number a frontline leader can influence this week. Tie it visibly to a financial outcome. Then hold the review cadence steady for two quarters before judging the results.
Measurement is a leadership behavior, not a reporting function. The organizations that get this right do not have prettier dashboards. They have fewer numbers, watched more closely, by people empowered to act on them.